


Abdo, Data Science and AI Trainer, Growth Tribe
Legend has it that a photogenic octopus called 'Paul' predicted the majority of the results of the World cup in 2010.

Years on, I still held on to the belief that reliable football predictions are nothing but a myth, a facade to promote a thriving betting industry. Paul was an oracle, a living proof that perhaps only randomness and gut feelings could pay off.
For the 2020 Euros, I was invited to a company-wide fantasy football league. The rules? simple:
- Predict the scoreline.
- Predict the first team to score.
- Predict the first player to score.
- Choose one game each round where the points are doubled.
- Points are aggregated across rounds and compared against those of other players in the league.
You're shown the most common predictions, and if you predict a scoreline that is uncommon (<10%), you will benefit from an underdog bonus if your prediction checks out.
Every round, you get to choose one game to double down on. This means you get twice the score.
During the first round, I didn't give it much thought. I went with my gut feelings. I relied on distant memories of these teams performing on previous occasions.
I ended the first round in gracious 17th place, out of 28 competitors and fellow co-workers.
I even thought about embracing the chaos and adopting a purely random approach. The odds were clearly not in my favour.
Matchday 2: I decided to change. I shopped around for tools that could help supplement my fractured intuition with a data-driven approach.
I utilised the Skeptical Optimist mindset: realising the hard limits on predictions that make football the game it is; not a game of favourites, but a game where favourites exist.
Now... prediction in football is an immense task, one of constantly shifting odds, numerous random variables, and a fertile ground for underdogs and upsets.
- Let's consider the Netherlands vs Czech Republic game. The Netherlands were clear favourites, yet they lost after a red card invoked a chain reaction, skewing the odds against them. The Czech Republic ended up winning the game 2-0, ousting the Netherlands from the competition.

My data-driven approach had already pulled me up to 10th place by the second round, 1st in the 3rd round, and earning me an overall 1st place finish. 🥇

Matchdays 2 and 3 saw my prediction accuracy increase significantly.
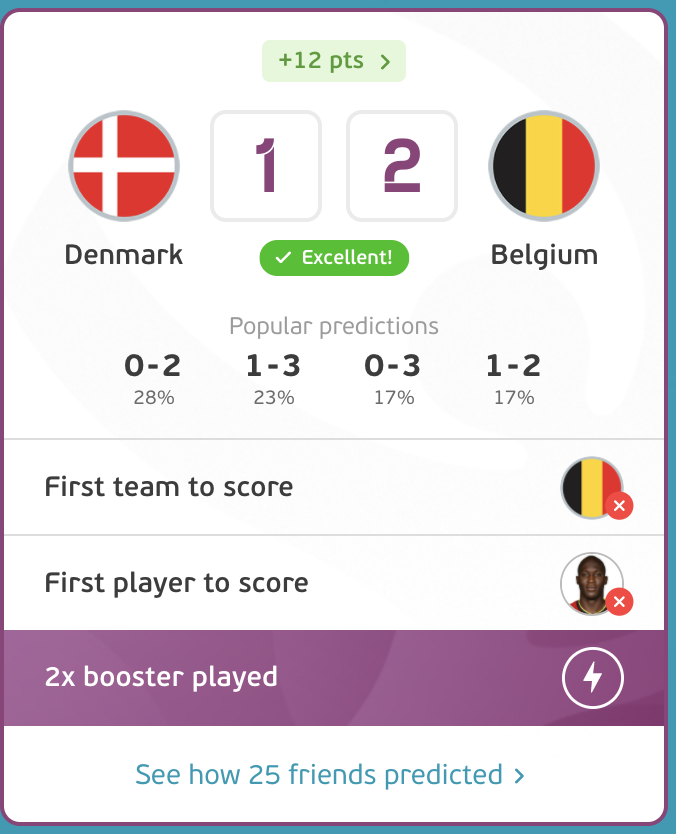
In Matchday 2, I was able to correctly predict 6 out of 12 scores. Realising Belgium had the highest probability and the highest **xG (**Expected Goals) in comparison to their opponents Denmark, I used the 2x Booster to double down.
Although I failed to predict the first team to score and the first goalscorer, my overall score skyrocketed. 🚀🚀
Matchday 3 saw my data-driven approach mature. I had correctly predicted 8/12 games. My booster points were well spent as I had correctly predicted the score and the first goal scorers of the Netherlands vs Macedonia game.
In total, I had also correctly predicted 9/12 of the first goal scorers. Only missing Sweden's shock win over Poland, Germany's laborious and expected tie with Hungary and forgetting to place my bets on the Ukraine vs Austria game.
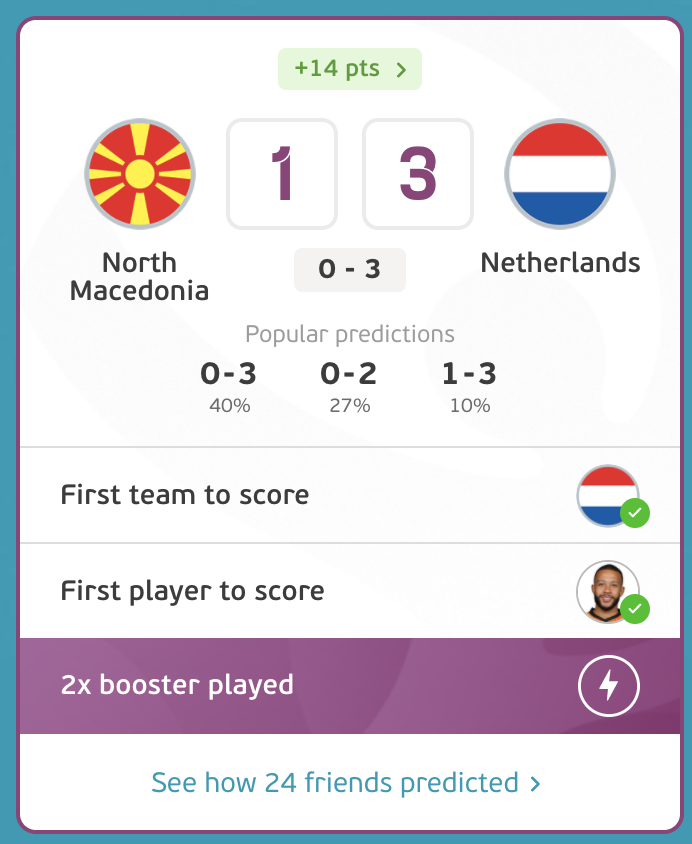
The highest points from a single game came from a safe bet on the Oranje team: the Netherlands.
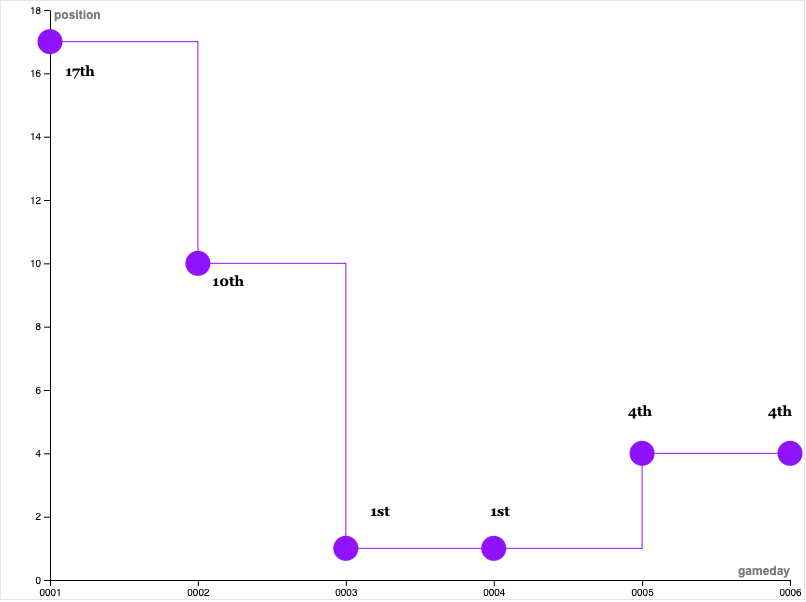
By Matchday 4, I was well equipped to win the competition, sitting comfortably in 1st place, with 10 point difference. How I did it? A mix of luck and a data-driven strategy is detailed below.

Position at Each Respective round:
Data can't help you predict the future, but it can help you prepare.
- My intrinsic strategy for prediction was based on 3 key principles:
- Identifying the likelihood of a win/tie/loss
- Identifying a plausible scoreline
- Identifying players most likely to score
- Taking reasonable risks. (There's an underdog bonus for predicting a scoreline less than 10% of the participants have predicted)
It is a multifaceted approach as each of these principles foreshadowed a complex task.
A forecaster would need to take into account the overall strength of the team, in addition to their defensive and offensive strength.
I would need to not only consider the overall form of the team (their record of wins/losses/ties) but also their tournament form.
This is because tournament football is a whole new ball game; things like tournament morale, home advantage and the learning curve of each team are all factors to consider.
My toolset borrowed from the work of other data scientists who trained complex and dynamic AI models and were kind enough to share their work.
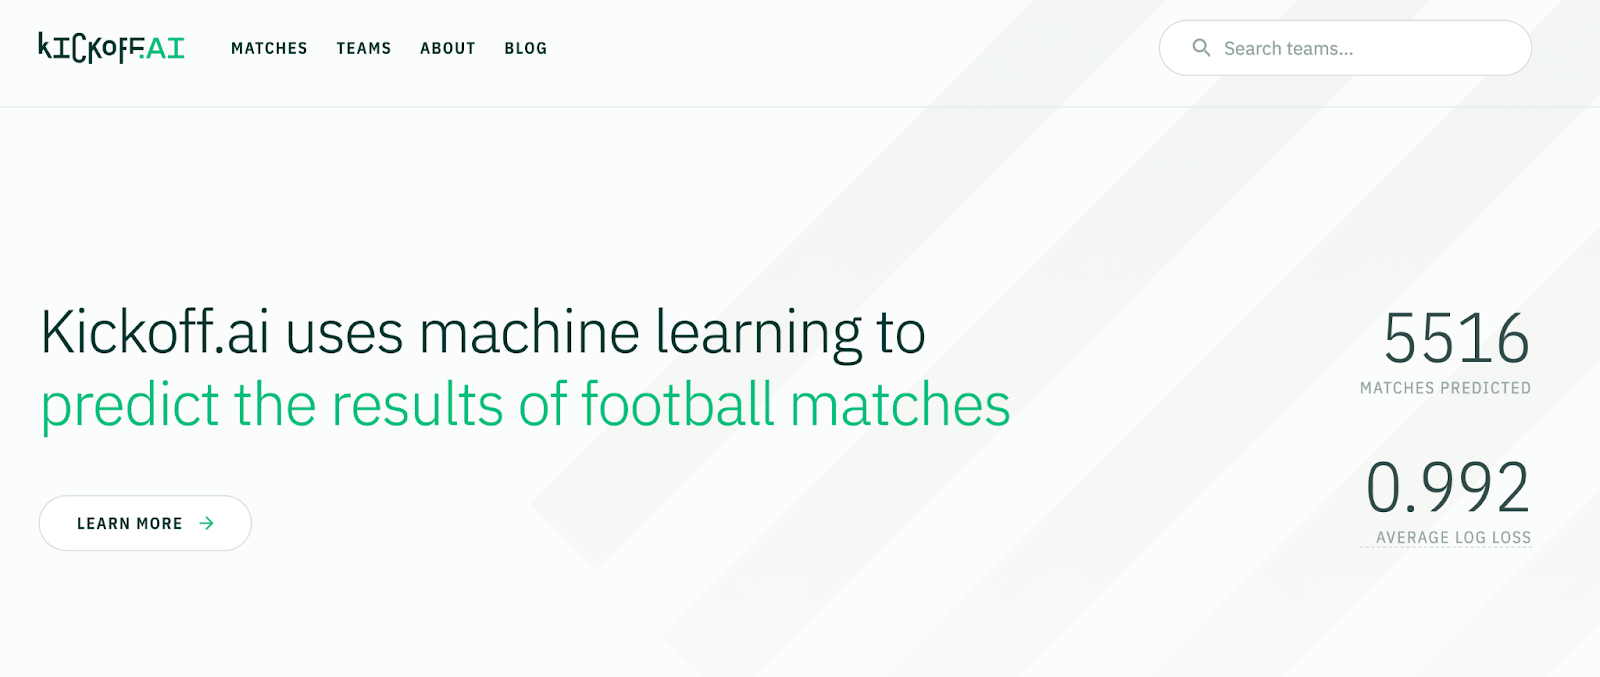
The first tool I used was kickoff.ai, a model trained on historical data which calculated probabilities of wins/ties/losses, based on the overall form of the teams, the relative strength of their opponents and their likelihood to bend the odds.
Kickoff uses Bayesian inference to estimate the probabilities of each result. Kickoff allows us to look back into how it performed, assess its accuracy. It uses a common prediction metric called **logarithmic loss (**log loss), which is a numerical articulation of the prediction's distance from reality.
Kickoff.ai use a compound performance score, based on a team's historical performance record, to predict probabilities of outcomes.
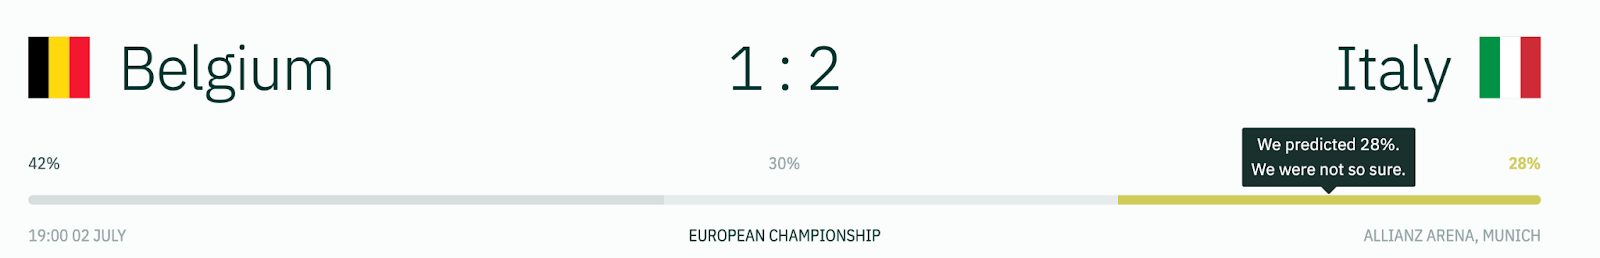
We're able to measure Kickoff's model performance by comparing the predictions with the actual score.
The kickoff model's output is to be taken with a grain of salt. It doesn't predict scores, but it gives probabilities to results.
It gives no space for upsets, random variables, unexpected emotional motives. Yet, it provided a good historical account of what the teams' recent legacies would place them in a head-to-head fight.
The model foretold an England win over Italy in the final, after all.
Thinking in shades of Maybe
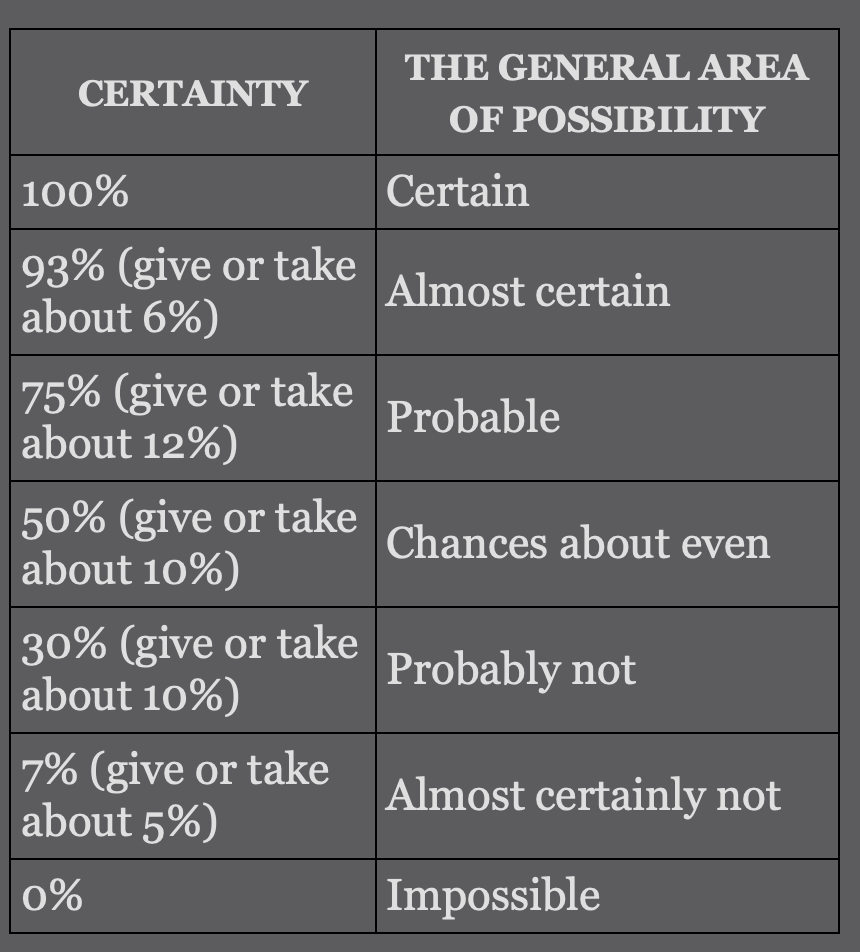
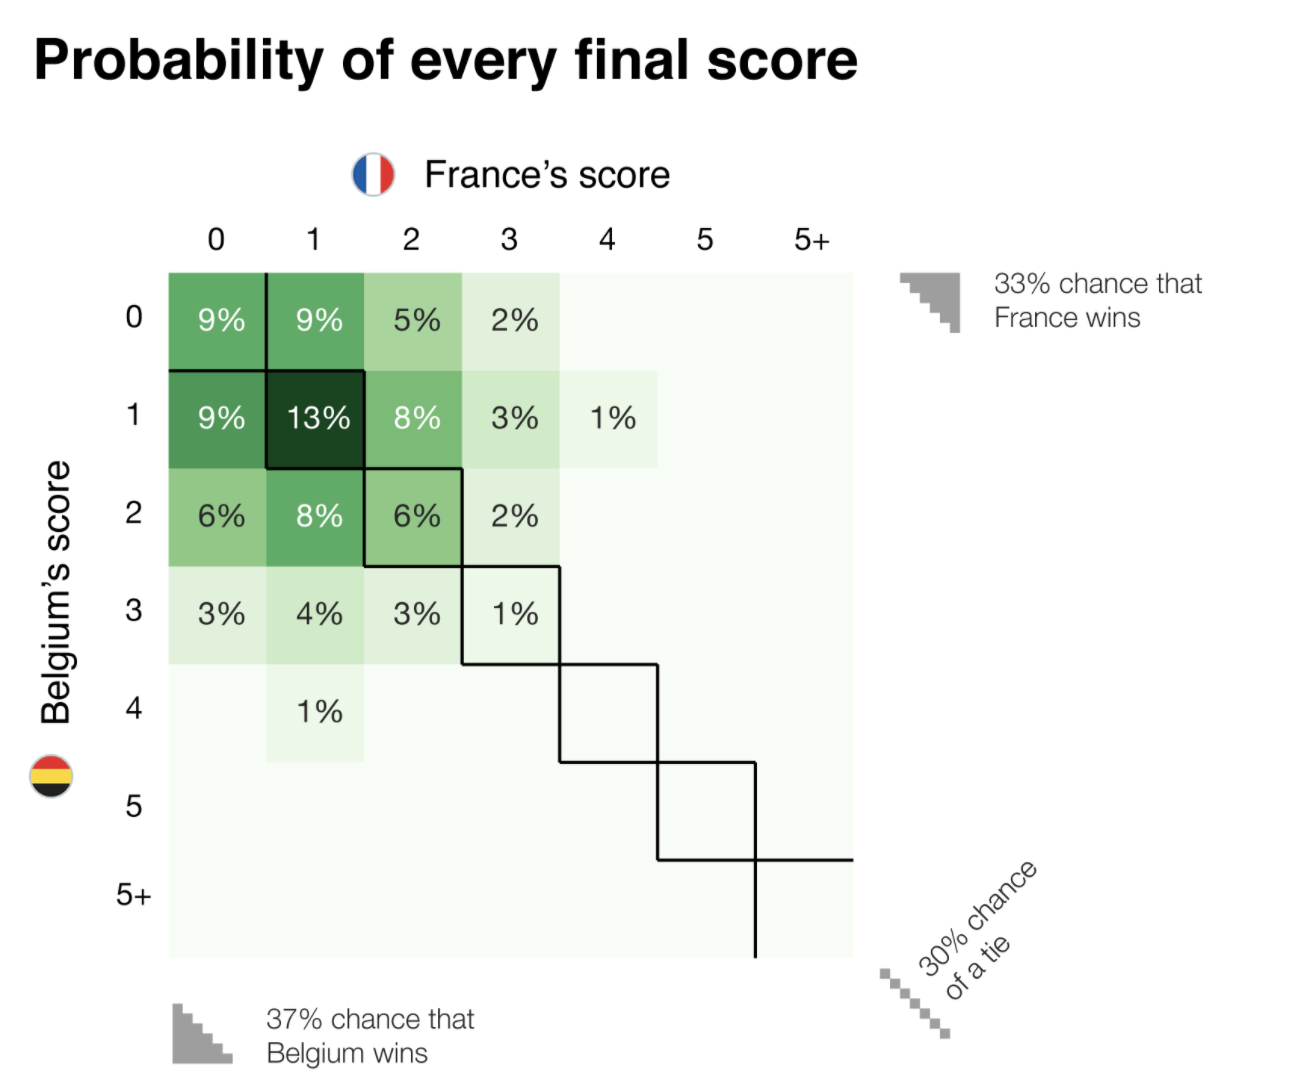
Consider the following chart sourced from the book "Superforecasting: the art and science of prediction"
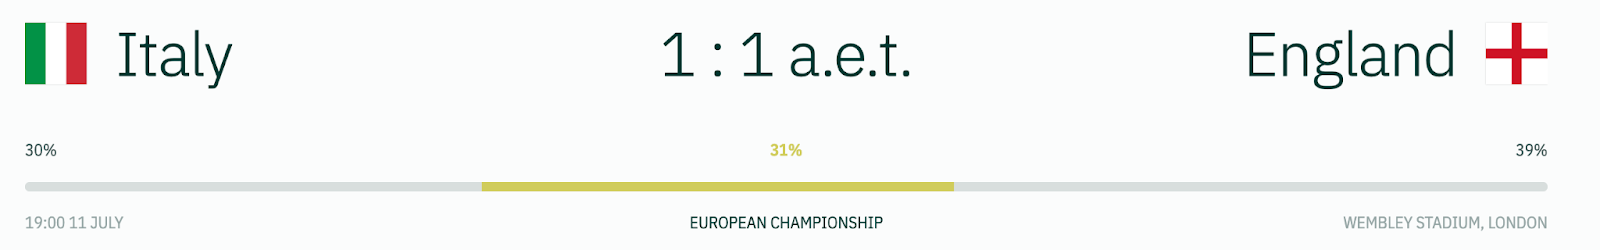
Even though the model predicted a 39% chance of an England win, with a 31% chance of a tie and a 30% chance of an Italy win, all three possibilities fall under the category of "probably not". What this tells us is that, even with everything taken into account, it's going to be a close call.
Fantasy Football tip: Here is a good chance to spread your bet, either going for a 1-1 score, or a 2-1 score where both teams have managed to get on the scoresheet, while one goes on to win it.
My prediction for the game was "2-1" for England. I vouched for the English since the kick-score of England is higher, and since I predicted the home advantage would play a larger role. Having both teams on the score sheet was the most tactical response to the even probabilities.
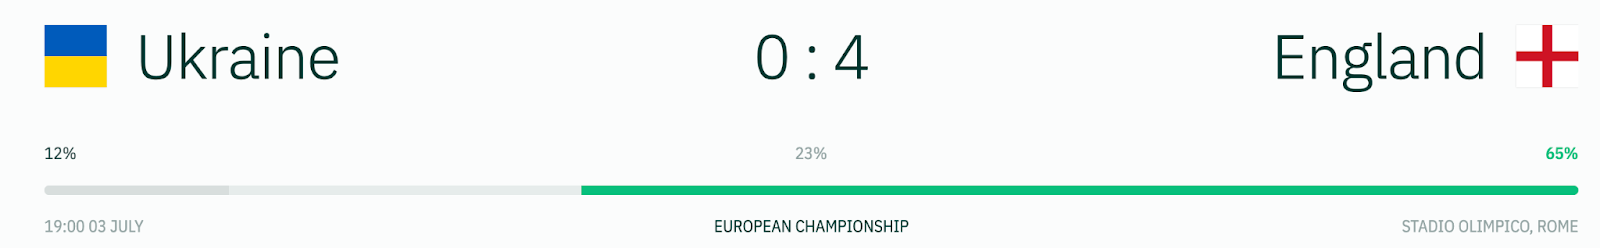
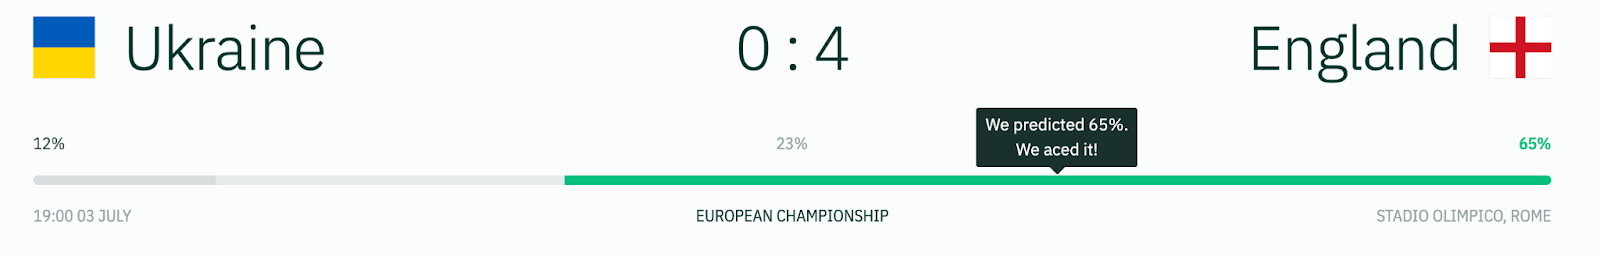
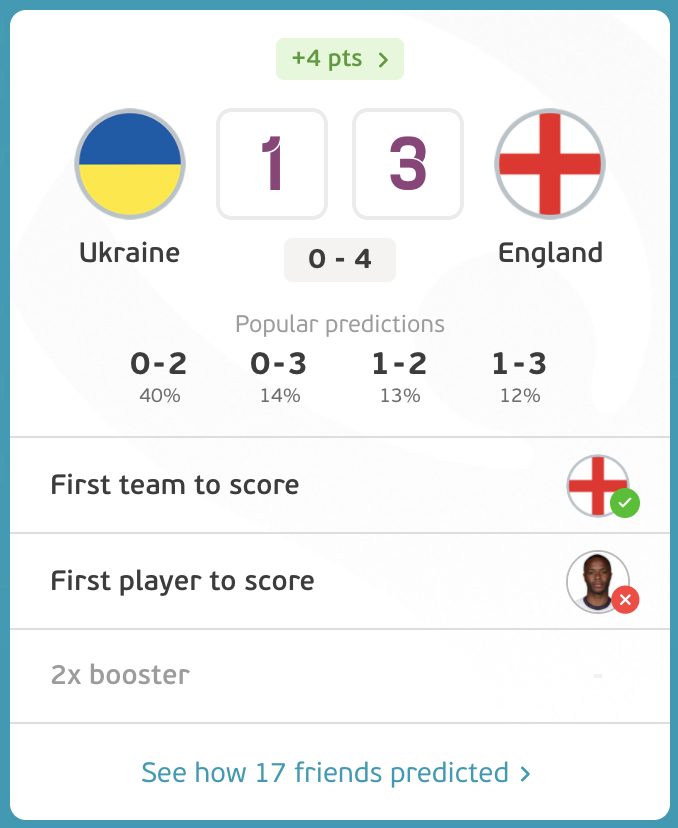
Here, we see that it was almost probable that England will beat Ukraine. The trick is to find out the score and first goalscorer.
Fantasy Football tip: Rooting for an England win is a safe bet. Double down.
I predicted "3-1" for England, yet failed to predict the first goalscorer. I also didn’t double down as I opted for the Spain vs Switzerland game happening in the same round.
Here, I went against the data and my point tally suffered in response.
The scoreline problem
Predicting results is complex. Estimating scores is even more complex. In the first round, before I opted for a more data-driven approach, I'd try to estimate the offensive prowess of each team and pose it against the defensive prowess of the others.
A more data-informed decision would have me anchor my prediction over xG scores. Expected Goals (xG) is a common metric in football analytics that estimates the number of goal opportunities that a team is able to create within a game. Just because a team was able to create X goal chances, doesn't mean they'll convert them all.
(Expected (xG) vs Actual Goal (aG) is a nice litmus test for how efficient a team is at scoring goals.)
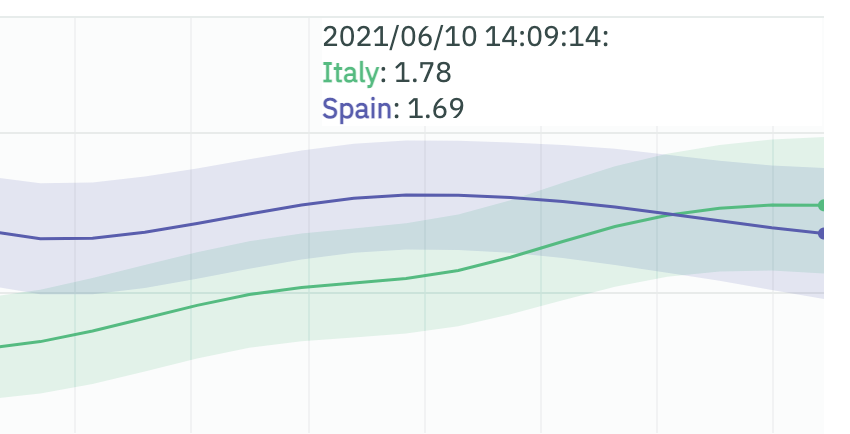
Spain vs Italy game was a prime example of this. With the two teams having a very similar form, xG gave us a glimpse of a deciding element in the game.
Italy had a smaller xG but their conversion rate was much higher. They made the most out of the few chances they got.
Spain on the other hand created more but was more wasteful. With an Italian defence much stronger than the average opponent, and a Spanish one that is more prone to penetration, the goal difference in the game was bound to be little.
Who will score first?
The most challenging of this predictive quest was to adopt a data-driven approach to forecasting first scorers. Although developing a model was possible, I suspect the reward wouldn't match the effort put in.
I adopted a simple scoring method instead. Here the xG vs aG metric could be helpful, as it exists for players too. However, only the players who play for the four big leagues at club level have reliable xG statistics.
In-tournament form and play styles greatly affect a player's likelihood to score. Here, I had to rely on a less rigid approach, assessing based on intuition, a rough map of indicators I adopted for this would be:
- High xG
- Designated penalty taker
- Already scored in the tournament
- International and tournament football goalscoring record.
Cristiano Ronaldo, for example, is a prolific goal scorer AND also a designated penalty taker for the team AND has the highest xG of all his teammates. He's a safe bet to make.
The computer says: It's not coming home.
Supercomputers can have the answers.
Sports Analytics Lab, DTAI, KU Leuven uses a computationally intensive Monte-Carlo dynamic. The simulation is run hundreds of times and each teams’ chances are calculated.
Monte-Carlo simulations can be powerful here because they allow space for random, and unexpected events (getting a red-cared, an injured player, etc).
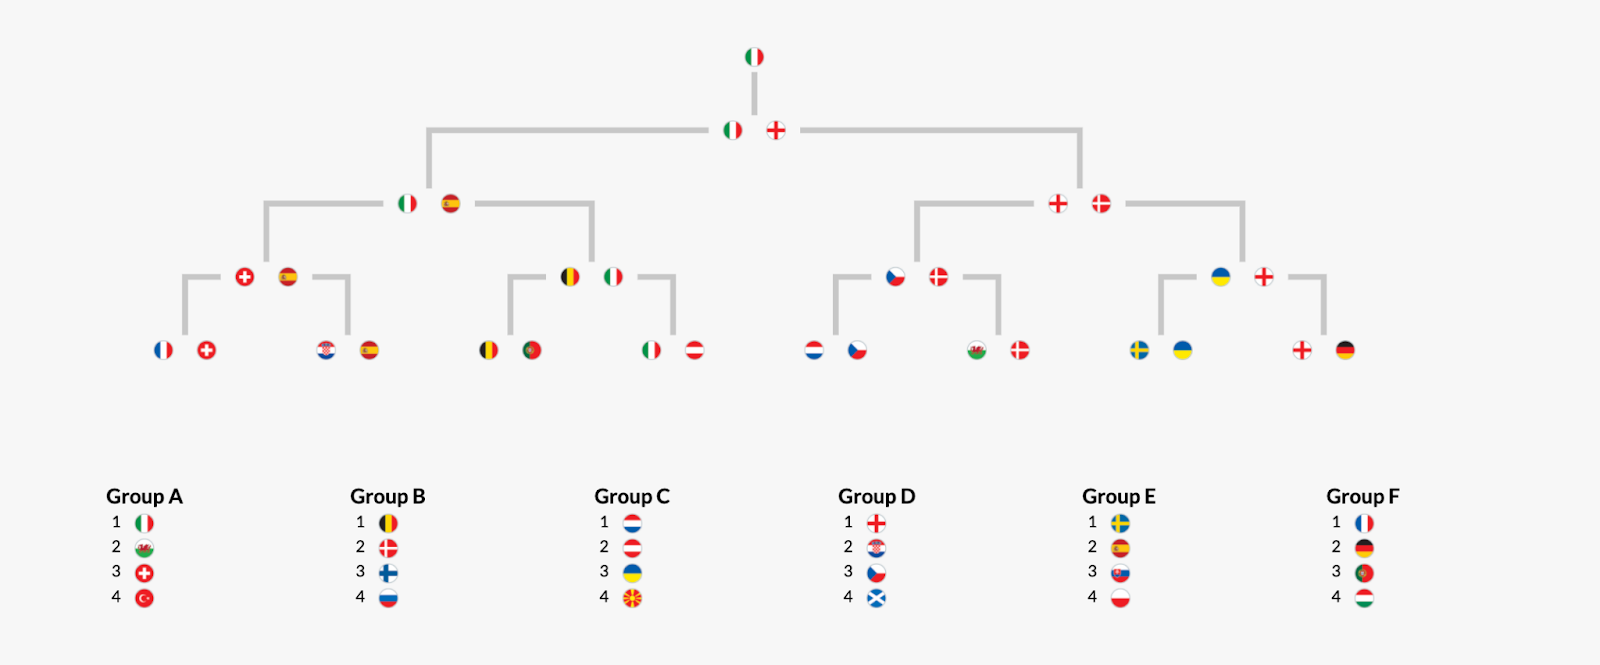
https://dtai.cs.kuleuven.be/sports/euro2020/
Their model was so powerful, that using only 20,000 simulations after the first round of group stages, they were able to correctly predict Italy's win, as well as England's triumph to second place.
More information about their process can be found here.
The Sports Analytics Lab uses a regression model to predict the probabilities of different score lines based on the simulation.
Football Fantasy Prediction in Summary:
Although sceptical, I tested out a data-driven approach to forecast football scores.
The test saw me go from 17th place to 4th, to eventually winning the company-hosted Fantasy Euro 2020 league.
My approach consisted of the following:
- Kickoff AI's scores for Result prediction
- Team xG and Sports analytics lab regression model for game scores.
- Player xG and gut feeling for the first goalscorer
- A healthy appetite for risk.
The whole experience was a small window into the world of sports analytics.
The fact that all this information was ready and available, and that the complexity of the available models was increasing ( as was their performance) tells me that a data-driven future for sports is inevitable.
It also demonstrated a vital use-case for human-in-the-loop - the models, with all their glory, gave suggestions on which I would base my decisions.
The final call was mine and heavily relied on my risk for appetite.
Unlike Paul the octopus, the data wasn't an oracle, but rather a lighthouse, giving the analyst pointers in order to sail a sea of possibilities.
So why not try it out?
See if you can use data to win your fantasy football league.
The new season is about to begin!
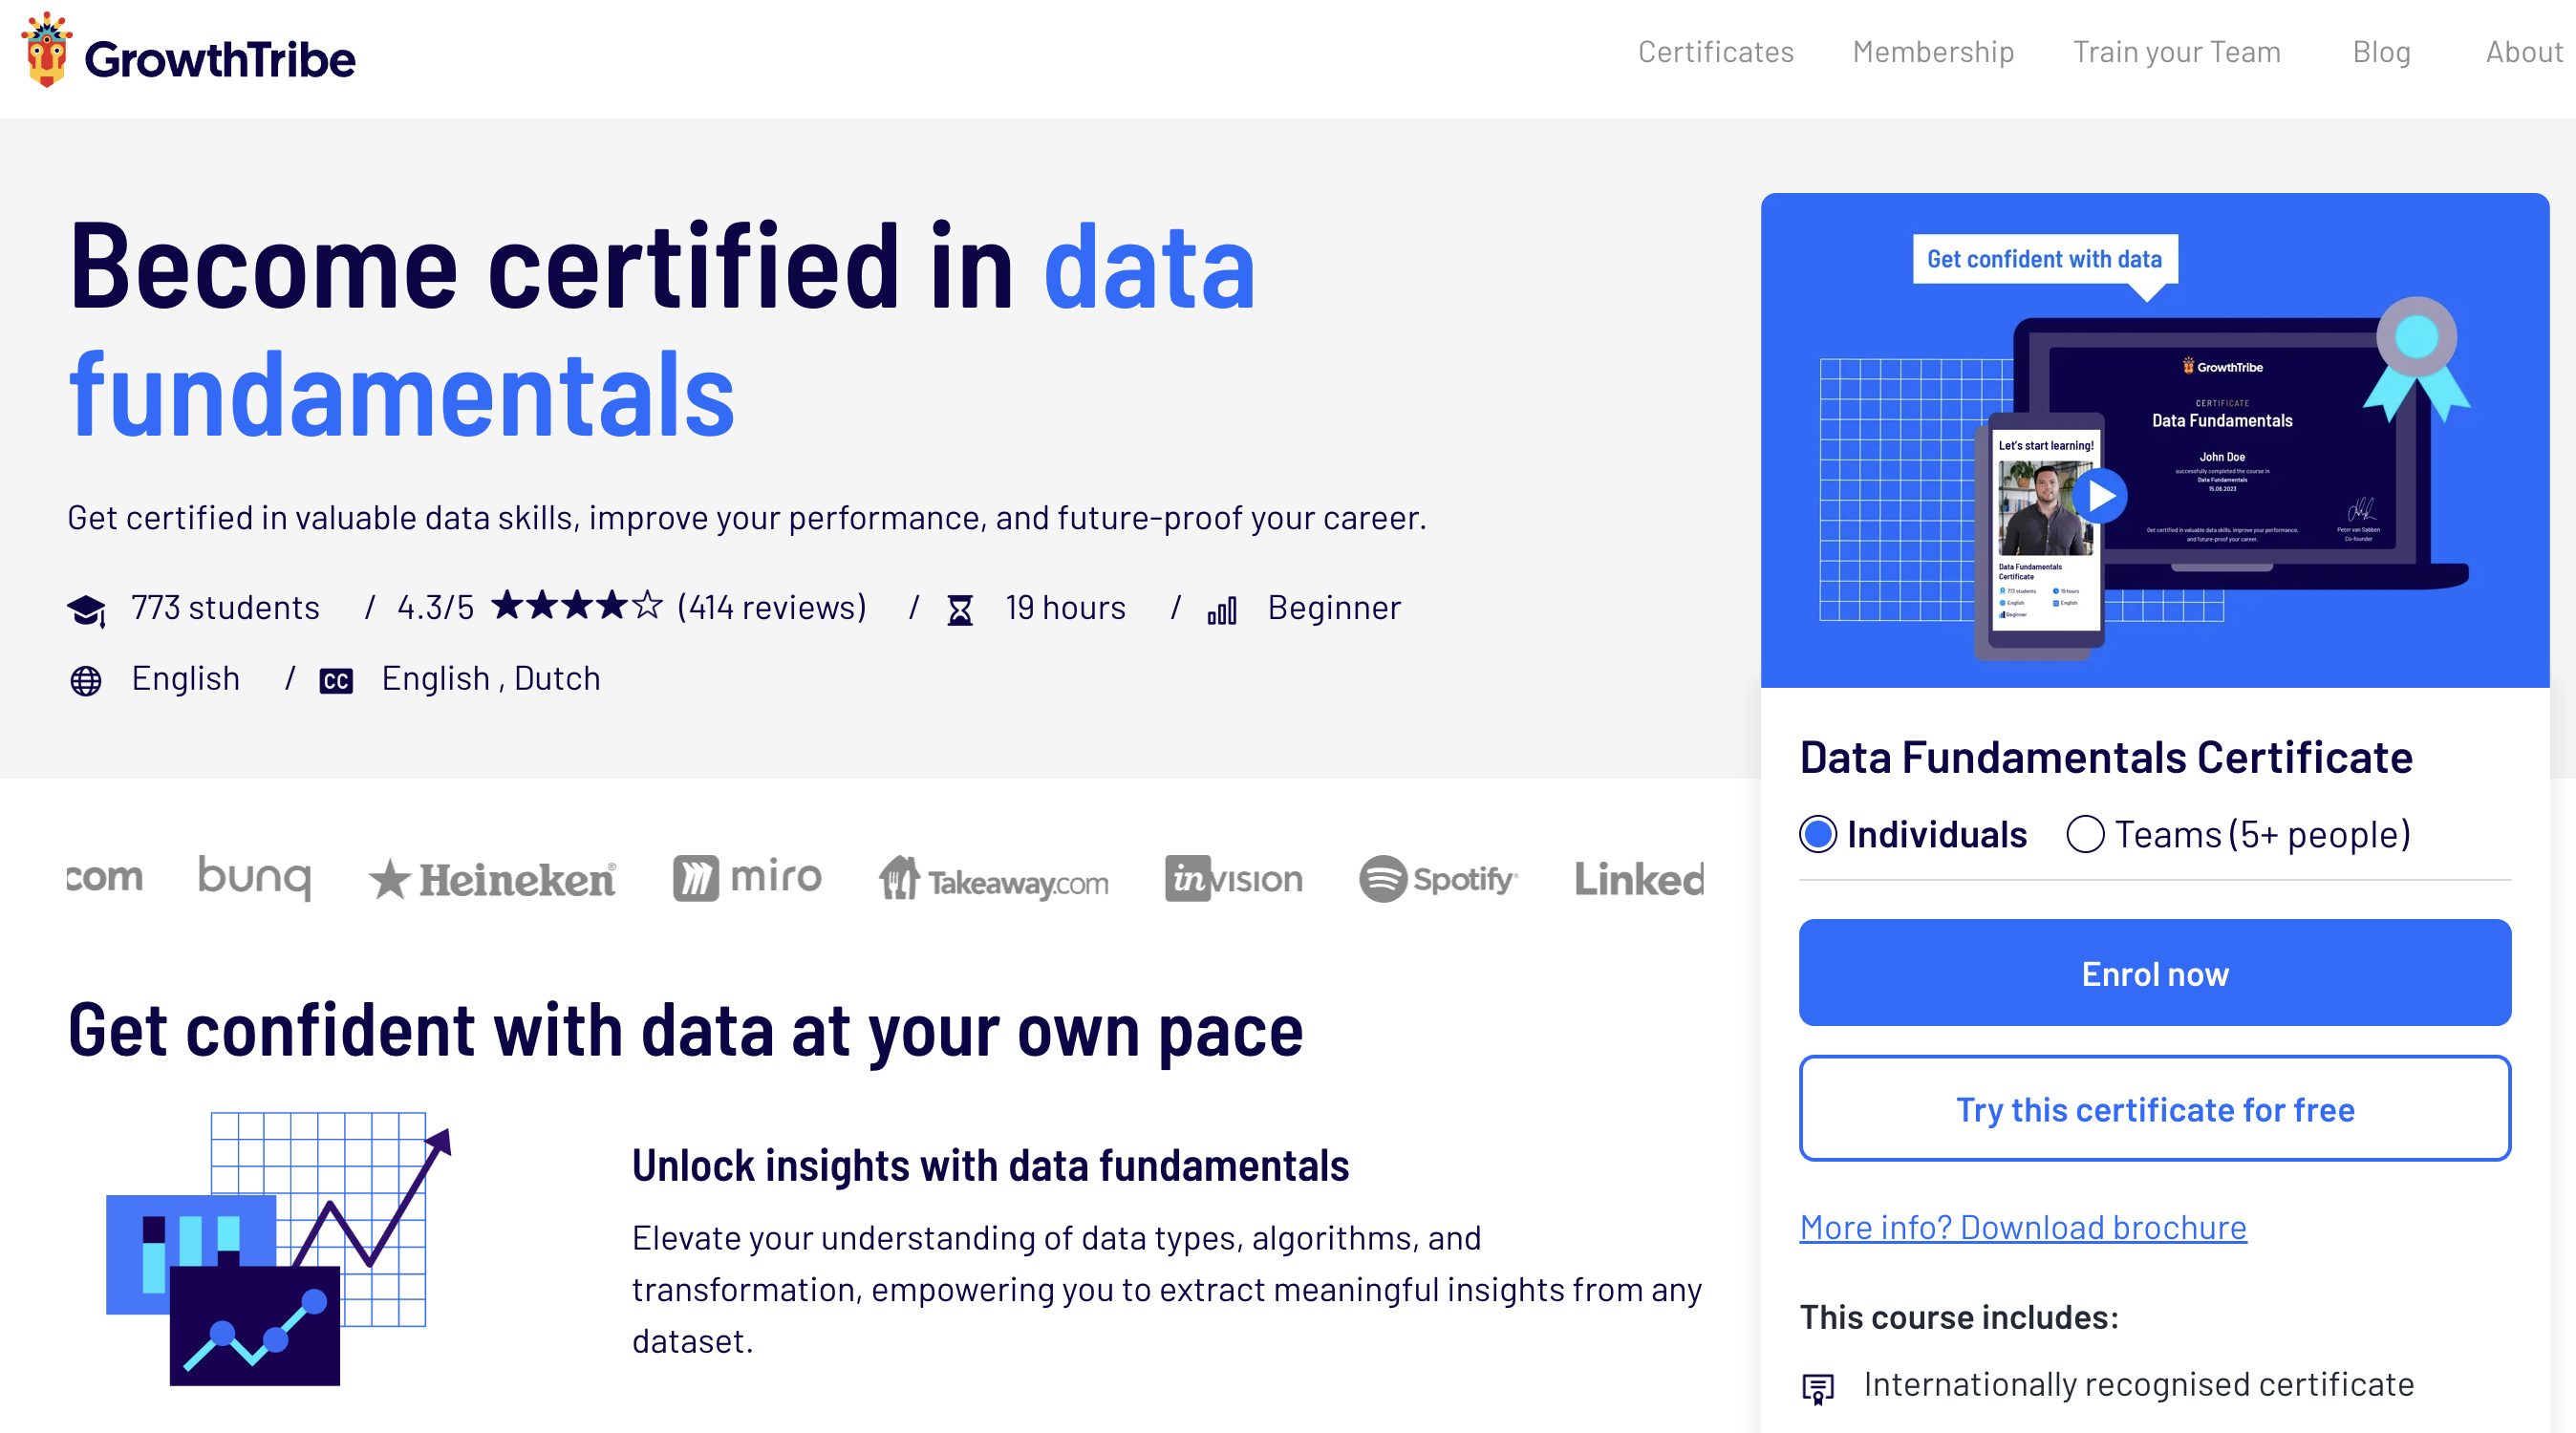
Become Certified in Data Fundamentals!
Help drive business strategy as a key decision-maker through data-driven insights that define real action.
Our comprehensive Data Fundamentals course will equip you with the skills and strategies needed to improve your performance and future-proof your career.
7 modules | 75 lessons | 7 tests | 7 exercises
- Module 1: Data literacy
- Module 2 - Analytics
- Module 3 - Experimentation
- Module 4 - Advanced analytics
- Module 5 - Data visualisation
-
Module 6 - The skills of data teams
-
Module 7 - Data Projects
Learning with Growth Tribe couldn’t be easier. All of our courses are designed to be flexible for the learner with self-paced content so you can manage your time and learning to suit your lifestyle best.
Join a community of over 35,000 certified alumni who share a passion for growing their skills and positively impacting their careers.


Latest articles

Boost your Revenue Growth using LinkedIn Social Selling
In a digital age where connections mean everything, leveraging...

The Power of Collaboration: Enhancing Team Performance Tactics
As organisations navigate complex challenges and strive for...
The Ultimate guide to boost organic growth in 2024
Imagine organic growth as the business equivalent of sculpting...

The best 2024 Business Development Guide
What exactly is business development, and how does it differ from...