


It's true. Data Analysts are in the in-crowd right now. And they are here to stay.
The World Economic Forum has listed Big Data Analytics as one of the four drivers of change in the world of work:
“ Four specific technological advances—ubiquitous high-speed mobile internet; artificial intelligence; widespread adoption of big data analytics; and cloud technology—are set to dominate the 2018–2022 period as drivers positively affecting business growth. “
You can read their full report here.
This means that the majority of businesses will require at least some, if not all, of the four types of data analytics, so is this a safe career choice? We think it is. Companies are on the hunt for skilled data analysts because the competitive edge they gain from the insightful use of their data is priceless.
Well, when we say priceless, read very profitable.
The University of Texas looked at the impact of data analytics on companies from the Fortune 1000 and discovered:
By using only 10% of their data companies could increase their profit by more than $2 billion every year
If you're considering a career as a data analyst, you might have some questions:
- How does data analysis work?
- What exactly do data analysts do on a day to day basis?
- Are they simply excel wizards who type some code and then draw up graphs?
In this article we hope to give you a better understanding of what your role as a data analyst would involve by looking at the different types of data analytics you would need to carry out. By the end of this article, you will have a clear understanding of the different stages of analyzing data and what skills, tools, and resources are required for each stage.
Hopefully, this will give you an idea of what data analysts do on a day to day basis, the 4 types of data analytics, and how they create those intuitive visuals and powerful insights.
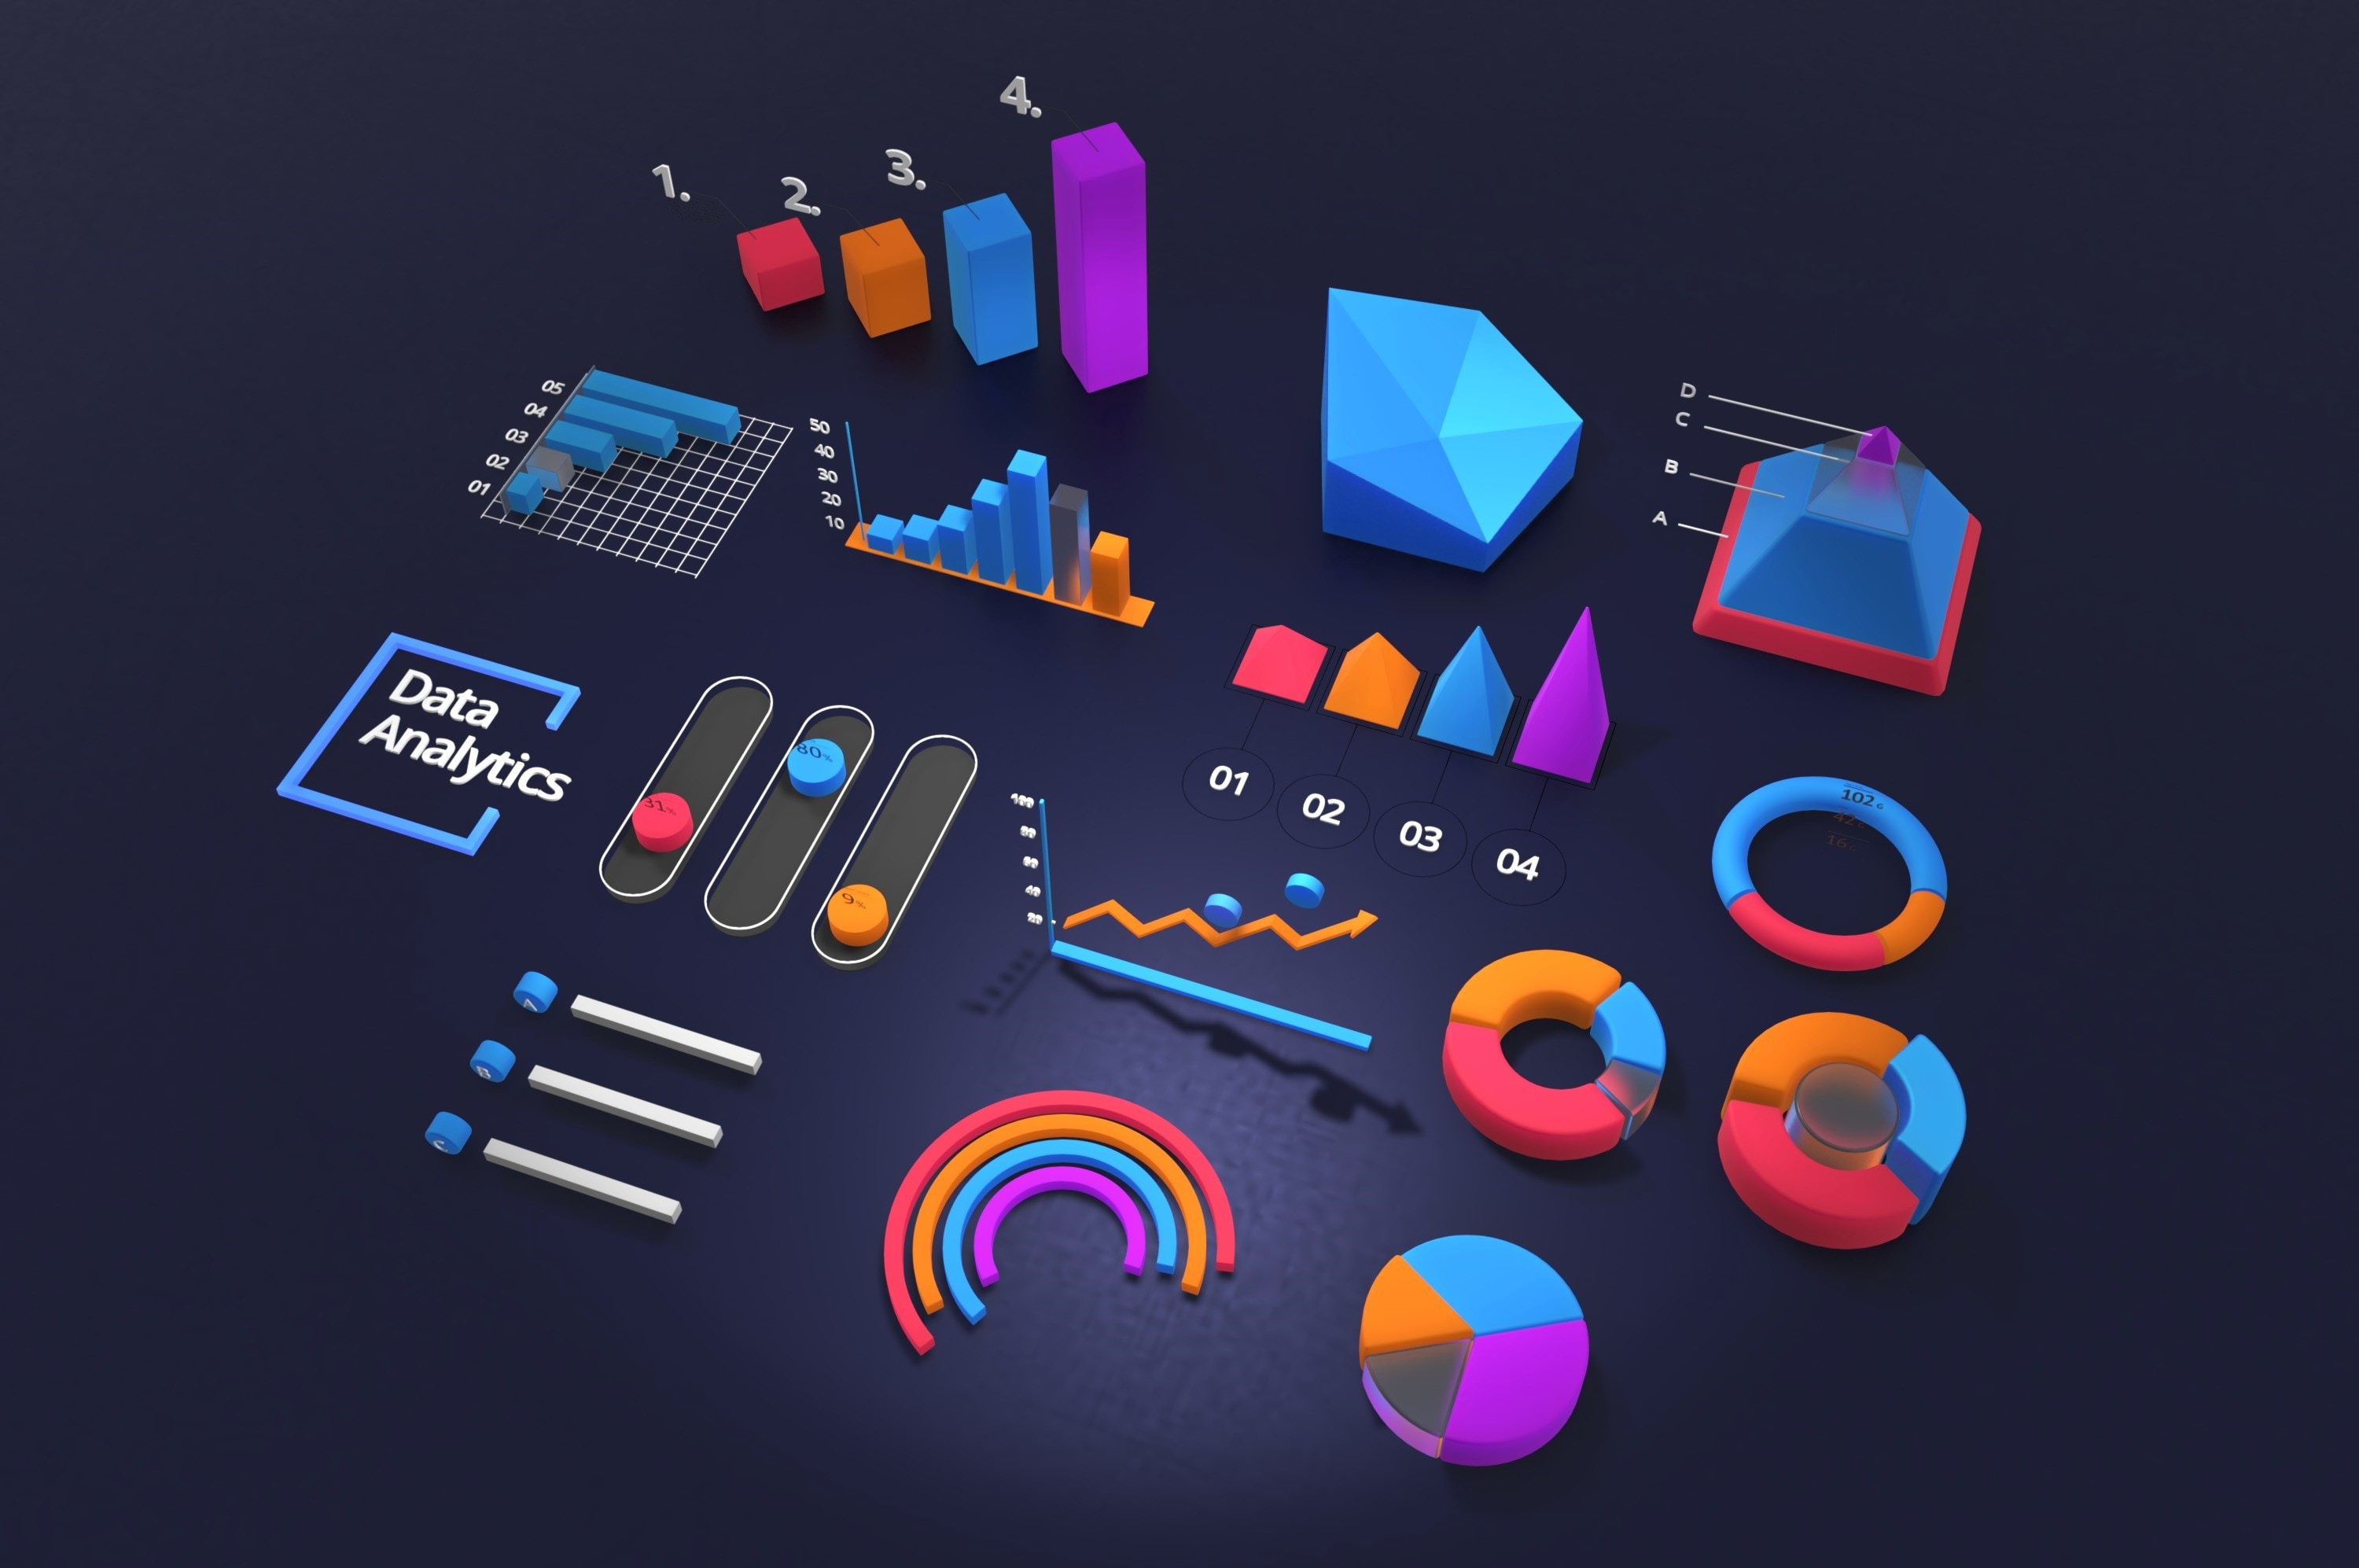
The four types of data analytics are:<
1. Descriptive
2. Diagnostic
3. Predictive
4. Prescriptive
Don't let the names put you off, they are simpler than they sound:,
1. Descriptive - Dude, what happened?
2. Diagnostic - Why did it happen?
3. Predictive - Based on that, what do we think will happen next?
4. Prescriptive - Based on our predictions, what should we do next?
As you go down the list, the analysis gets more complicated. Each stage requires more resources than the previous one, which also means it costs more.
In an ideal world, a lot of businesses would love to be able to complete all four stages of analytics on their data. The reality is most can do descriptive and diagnostic, some can do predictive and few do prescriptive. Let's dive in and have a closer look at each type.
1. Descriptive Analytics
Have you ever looked at your bank balance and thought: 'Wow, where'd all my money go?". Then you run through a mental checklist of all the items you bought and the monthly subscription you forgot to cancel - ouch!
That is a very basic example of descriptive analytics. You look at the data and you draw a conclusion about what happened. Although it is the simplest of the four analytics, it is the starting point for all of them. You can't do the other three without descriptive analytics. This has to be your first step.
In business or healthcare, the data and conclusions are of course more complex than the bank balance example. You'll have data from lots of different sources and you'll need to spend time gaining an in-depth analysis of what happened in the past.
Businesses need to do this, for example, to find out what marketing efforts are working for them. Keeping track of which activities generated the most ROI is critical to future marketing and ultimately the success of the company.
How do you go about performing descriptive analytics on complex data? With a lot of statistics.
You organise your data into tables and then calculate things like the mean, the standard deviation, skew, quartiles and so on. For example, you might work for a company that are trying to reduce congestion in an area, they have data on what types of transport people are using. You might look at the data and work out the mode- most common mode of transport, the average number of cars on the roads at peak times and so on.
If you’re interested in how this type of data analytics works, the best way to learn is to complete some projects and, as we always say, build up your portfolio. Diagnostic data analytics is often done manually and there are plenty of tools available to speed up the calculations.
Microsoft have created an add on for Excel called the Analysis Toolpak, why not download it here and have a go at some of your own descriptive analytics? There are some great tutorials here for you to start with.
For an in-depth analysis of tools available, you’ll find a detailed list here.
2. Diagnostic Analytics
The logical next step is to work out why things happened the way they did. This stage helps to create connections between data and patterns of behaviour. To do this effectively, you will need to start using a toolbox of techniques like:
- Drilling down - focusing on specific parts of the data to find patterns. You shift from an overview of the data to a more detailed view in the same dataset. You can read an in-depth explanation here.
- Data mining - an automatic process to find patterns and valuable information from data sets. You can learn more about data mining and how it works here.
- Finding Correlations - Did an increase in one thing cause another? How do you find correlations? An in-depth explanation is available here.
Let's look at an example:
A company website receives thousands of visitors every day, on certain days it spikes really high and once a month it dips. Diagnostic analysis would help in discovering what causes the fluctuations.
You would start by asking questions, like:
- Are the peaks in line with advertising campaigns?
- Did an influencer mention the brand?
- Was a new blog post released?
In other words, we would be looking for positive correlations which are found by creating scatter diagrams. One axis might show dates of each new blog release or ad campaign, the other axes would show visitor numbers. This would give an instant overview of what might be causing the peaks and dips.
What are the benefits of diagnostic data analytics?
Performing a diagnostic analysis allows a business to understand why things are currently happening the way they are. It identifies which actions should be increased and which actions are not generating an ROI. If you can run effective diagnostic analysis you help with the overall success of the company and play a large role in its planning and strategy.
It's definitely worth looking into.
Are you curious to see how you’re doing in the digital realm?
👉 Our cutting-edge free IQ test is the key to unlocking your inner digital genius. Find out your IQ score today!
We measure your cognitive ability in the most in-demand digital skills
- Digital Marketing
- Data Science & Analytics
- Project Management
- Emerging Technology
- UX Design
- Programming/Coding
- Web Design/Development
The report will give you an IQ score, as well as a breakdown of your strengths and weaknesses in each of the digital skills we measure.
3. Predictive Data Analytics or "What do we think will happen next?"
Now we're getting to the cream of the four types of data analytics. After you've answered the what and the why, this is the next stage. This type of data analytics is all about making predictions based on what has happened so far and is a highly valuable process for forecasting.
The video below provides a concise and interesting explanation of predictive analytics and where it's used.
However, it does require more tools, for example, IBM Watson Studio or RapidMiner Studio which provide dashboards and functions to carry out predictive analytics and make the whole process simpler and easier to collaborate. You can read more about available tools here.
Predictive analytics also requires more skills and knowledge from the analysts using the tools, for example:
- The mindset behind forecasting and being critical of data is different from doing a diagnostic analysis. You need to be more proactive and target driven.
- Although you have tools and software that do the predictions for you, how well they work depends on the inputs provided. You need enough experience or knowledge to know if the model is good or accurate enough.
- Knowledge of machine learning and how they make predictions is super useful for predictive analytics.
- The market for predictive analytics is changing rapidly, so you and your organisation need to keep up with developments.
This article does a nice job of explaining the skills you need in more detail.
All of this makes it more expensive and thus is not always possible for every company.
Hint: If you add this to your skills arsenal you will be an asset to your organization and worth more, so keep that in mind when negotiating your salary.
"The step between Predictive Analytics and Diagnostics Analytics is a big one. Predictive Analytics involves techniques such as regression analysis, forecasting, multivariate statistics, pattern matching, predictive modelling, and forecasting."
In other words, it requires more work!
Predictive analytics is an advanced type of analysis. It has lots of advantages because it helps businesses prepare for more types of outcomes. Especially if they make use of machine learning and act on the predictions made.
There is an easy to follow set of tutorials on machine learning and predictive analytics here.
But, as we all saw clearly during the pandemic, any kind of forecasting is sophisticated guessing. We can still be surprised and get the outcome wrong. The accuracy of the predictive analysis relies heavily on how accurate the descriptive and diagnostic analysis is and also how stable the current situation is.
Think about how the pandemic played out compared with the predictions. Some models were way off and these were made by top scientists. Some things are just difficult to predict, and are known as ‘wicked problems’.
But the harder something is, the more valuable it becomes. The predictive analytics market has been projected to be worth $10.95 billion this year and it's been growing by 21% each year since 2016. More info available in this article.
Businesses have huge demand or high needs for predictive analytics, they need to know what their customers will want next, how much money they can expect to make, what investments will cost etc.
So how can you become a real life fortune teller for businesses and enjoy a share of this growing market?
- Get seriously good at statistics and all the different types of statistical analysis
- Take some online courses
- Build up a project portfolio to show you can apply your knowledge
- Find a job as a data analyst in a company who need predictive analytics
It's not an overnight process, but it's definitely worth putting in the time and effort.
4. Prescriptive Analytics
If data analytics was made up of desserts, prescriptive analytics would be a deliciously tempting chocolate truffle. This is the most expensive and resource-intensive stage of analytics and that's why not all businesses can implement it.
Prescriptive analytics uses an optimisation process to help solve the problem of making a complex decision.
"Prescriptive Analytics is a form of advanced analytics which examines data or content to answer the question “What should be done?” or “What can we do to make _______ happen?” - Gartner.com
If you've ever used a sat nav device on a long journey and watched it update your route as you go based on traffic, roadworks, accidents and so on, you have seen prescriptive analytics in action.
It's not just for journey planning though, prescriptive analytics is used in a range of different industries and applications. Have you noticed how social media platforms keep you hooked by constantly suggesting content that they know you’re interested in?
“For example,” TikTok’s website says, “if you finish a video, that’s a strong indicator that you’re interested. Videos are then ranked to determine how likely you’ll be interested in each video and delivered to each unique ‘For You’ feed.”
Or have you ever had a text from your bank asking you to verify an unusual purchase? That’s an algorithm using prescriptive analytics to keep an eye on the millions of transactions that happen and questioning anything that doesn’t seem normal based on a person’s usual transactions.
It is used anywhere where complex decisions need to be made where there are lots of decision variables, different ways to achieve an outcome and limitations such as budgets.
You can read more interesting examples of prescriptive analytics here.
How do you go from data to a prescribed action plan?
Most forms of prescriptive analytics use machine learning algorithms that look at the data the company has and run a series of queries and scenario models to come up with recommended next steps.
The process starts with a problem that the business needs to solve. Create a model that accurately represents the problem. Create a user interface that allows users to input data and create different scenarios and analyse the results. Then implement the model that works best.
You can read more about the full process with some interesting examples of prescriptive analysis here.
How can you learn prescriptive analysis?
We would recommend learning as much as possible about neural networks, machine learning and modelling. Because, even though most of prescriptive analytics is done by AI, it still needs a human to verify the recommendations it makes.
Also the the quality of the initial model is critical to the success of the analysis, so the more you understand about data modeling and how it uses the input data, the better your results, which means your work will help build the success of the company you work for.
All businesses are different, but most have similar objectives when it comes to things like customer service, making a profit and cutting costs. Prescriptive analysis is perfect for strategic planning and tactical activities that will help to meet those objectives.
Benefits of prescriptive analysis
- Improve Operations
- Manage resources more efficiently
- Mitigate Risks
You can read more about the benefits here
Conclusion
Companies who make use of the four types of data analytics make significant gains in their profits and increase customer satisfaction with better insights, giving them a competitive edge.
Although performing all four types of analysis is desirable, you can help a company perform better just by doing diagnostic and descriptive analytics.
Over the past few years big data analytics has grown and with increased personalisation on social media, critical improvements in cyber security and as we create and consume more and more data, it makes sense to believe that this trend will continue.
If you are considering a career as a data analyst, we hope this article has helped you see the potential it has and that if you put in the time and effort to learn, your skills will be highly valued in any organisation.
We’ve packed this article with sources and tools for you to use and gain more knowledge so do jump in and learn everything you can and build up your portfolio.
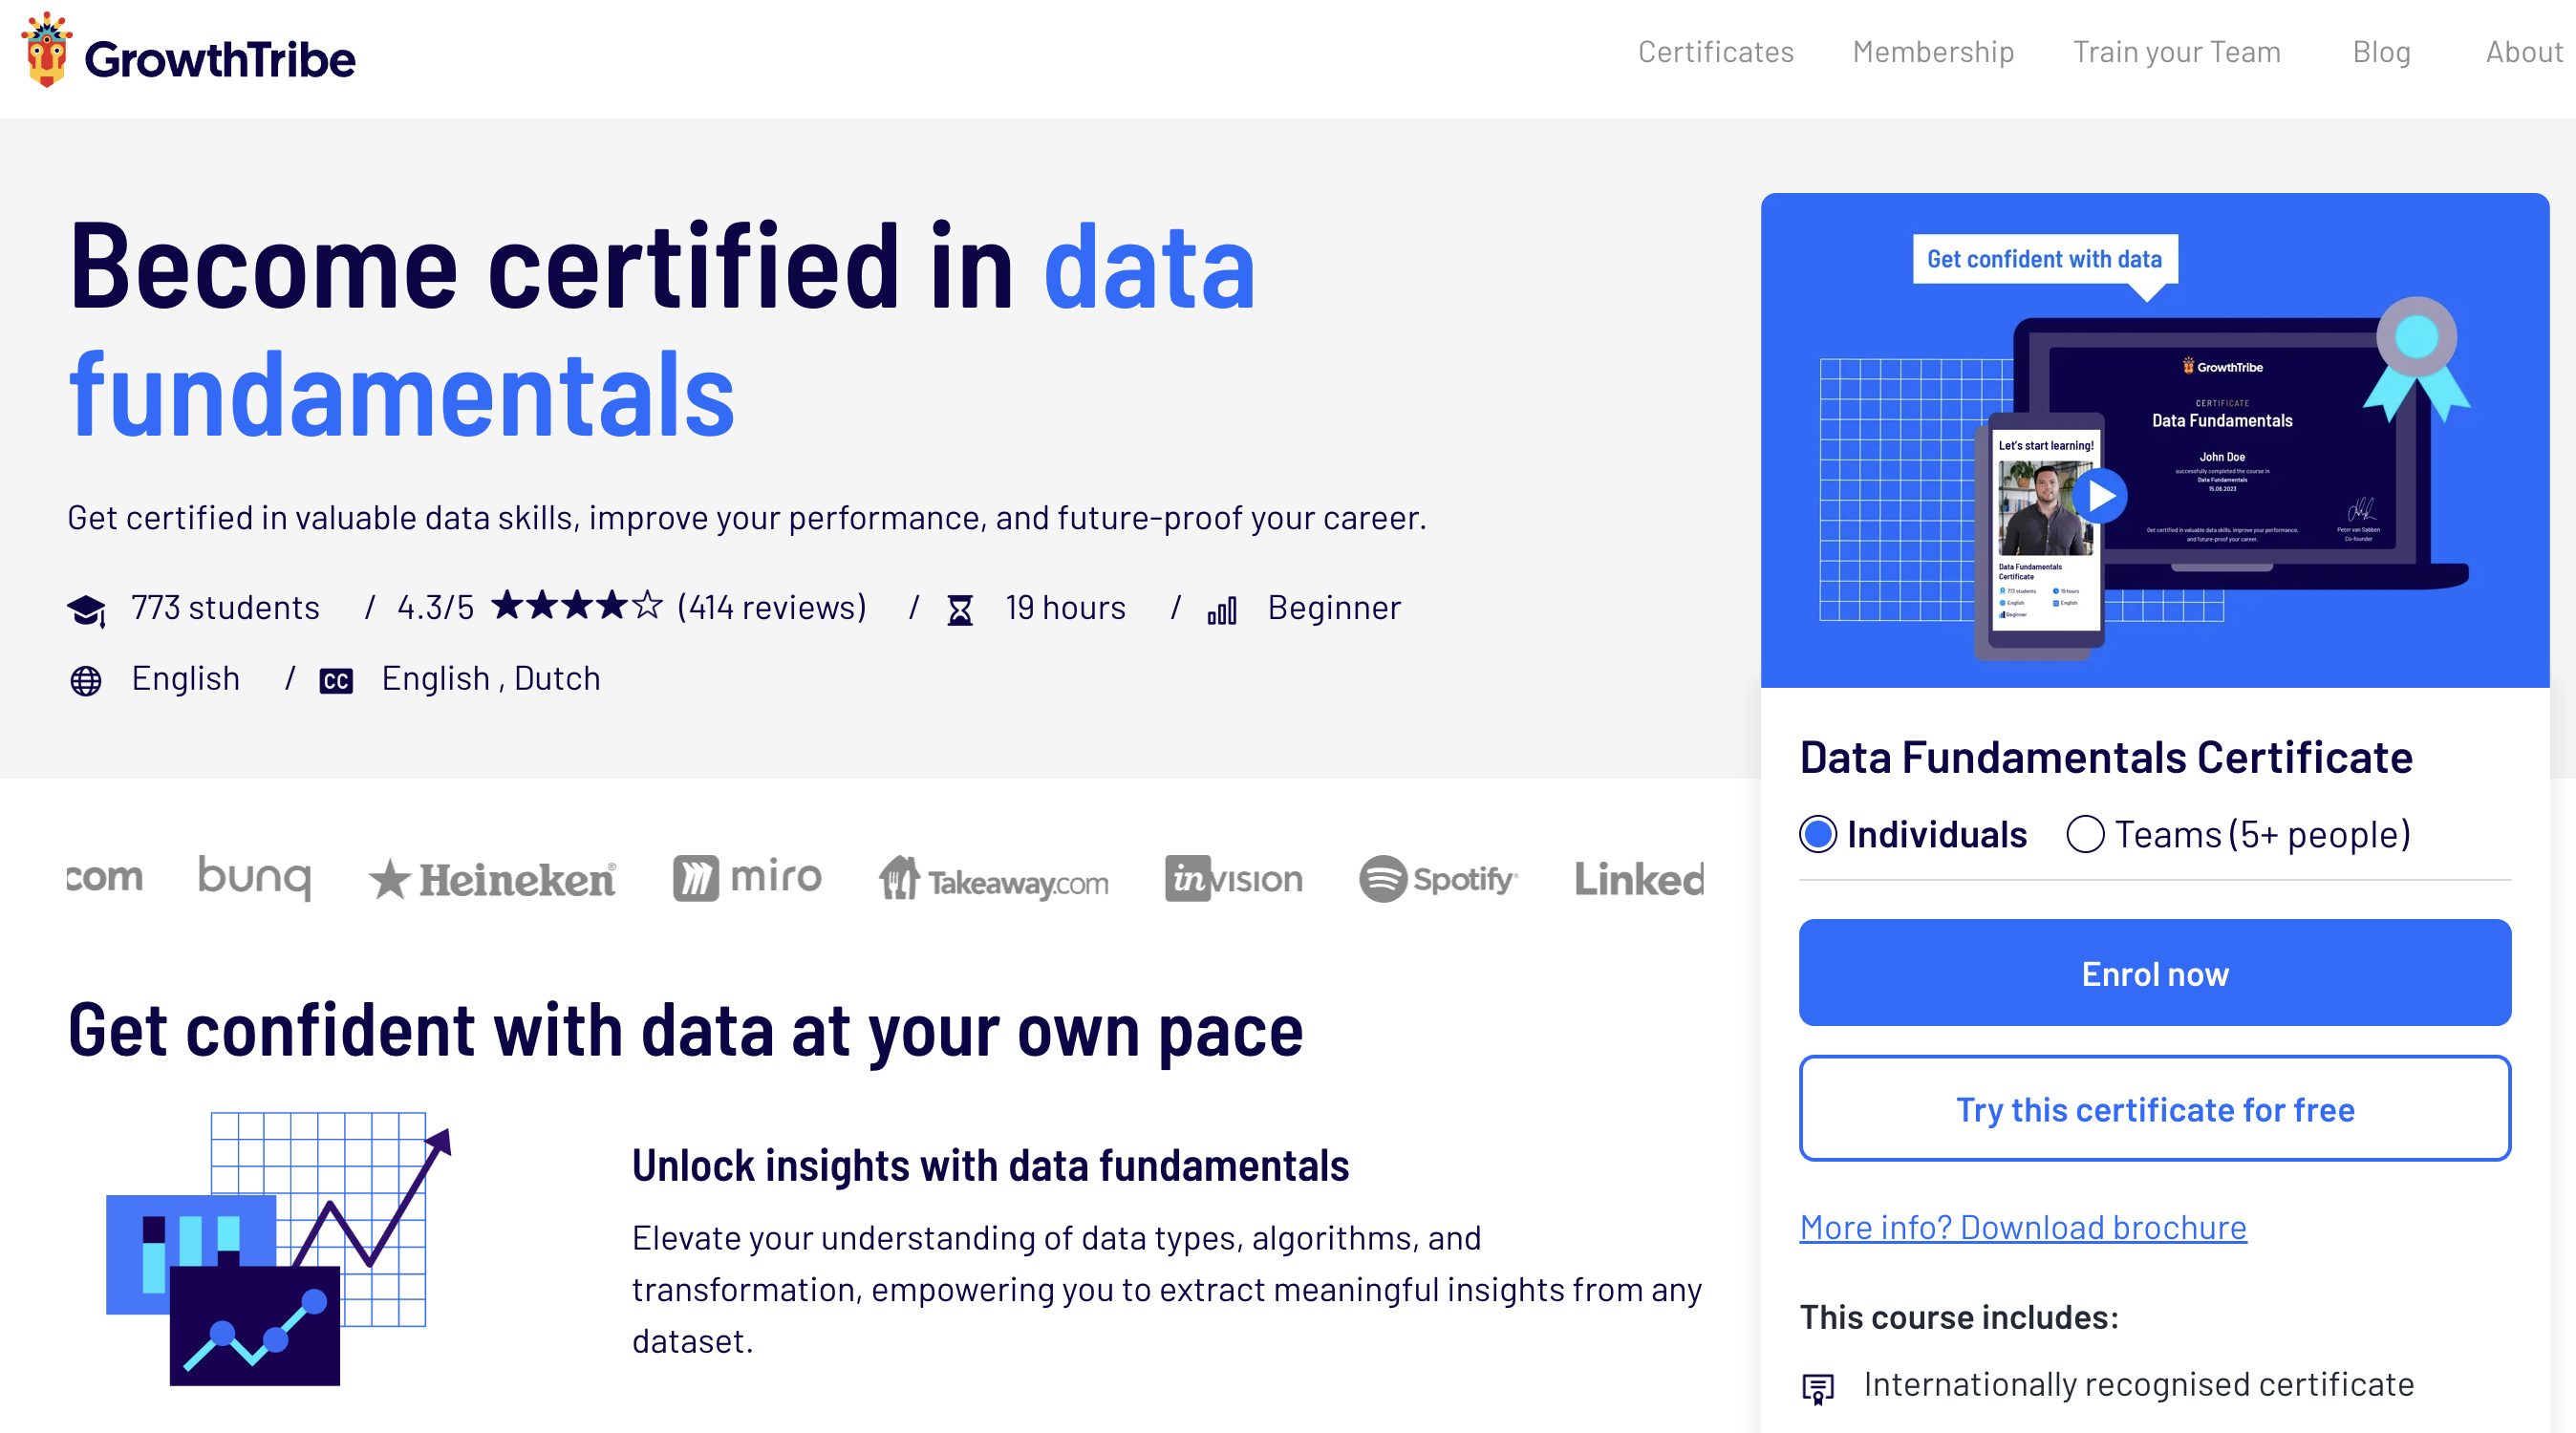
Become Certified in Data Fundamentals!
Help drive business strategy as a key decision-maker through data-driven insights that define real action.
Our comprehensive Data Fundamentals course will equip you with the skills and strategies needed to improve your performance and future-proof your career.
7 modules | 75 lessons | 7 tests | 7 exercises
- Module 1: Data literacy
- Module 2 - Analytics
- Module 3 - Experimentation
- Module 4 - Advanced analytics
- Module 5 - Data visualisation
-
Module 6 - The skills of data teams
-
Module 7 - Data Projects
Learning with Growth Tribe couldn’t be easier. All of our courses are designed to be flexible for the learner with self-paced content so you can manage your time and learning to suit your lifestyle best.
Join a community of over 35,000 certified alumni who share a passion for growing their skills and positively impacting their careers.


Latest articles

Boost your Revenue Growth using LinkedIn Social Selling
In a digital age where connections mean everything, leveraging...

The Power of Collaboration: Enhancing Team Performance Tactics
As organisations navigate complex challenges and strive for...
The Ultimate guide to boost organic growth in 2024
Imagine organic growth as the business equivalent of sculpting...

The best 2024 Business Development Guide
What exactly is business development, and how does it differ from...